Saturday, January 31, 2015

Amazonia: Arm Chair QB

This is a 7 part workout.

1. Beer bottle curls.

2. Couch squats.

3. High jumps, for every touchdown.

4.  Bathroom lunge and plunge, after the chilli.

5. Dips, as in chips.

6. Victory dance.

7. Sit up, and drive home safe.

Penalties are suspended for the day. Happy Superbowl!

Thursday, January 29, 2015

Amazonia: Calfine Free


Non stop circuit.

8 exercises, 2 movements.

Run 1/2 mile, 80% effort, max incline.

1. Calf raises.
2. Ski jumper.
3. Agility Dots, one leg.
4. Jumping Jacks.
5. Power Skips.
6. Mountain Climbers.
7. Toe raise Planks.
8. Single leg calf raises.

1 mile elliptical.

30 seconds per exercise. Circuit is complete when all participants are finished with 1.5 mile movement.

Warriors on tread or elliptical don't switch until they have completed movement.

Alternate legs for each set of agility dots and single leg raises.

24-30 minutes total.

This video demonstrates calf raises, ski jumper and agility squares:

This video demonstrates powers skips and other calf exercises: 


SolarCity delivers

SolarCity

SolarCity delivers better energy

SolarCity is America's largest solar power provider. We make clean energy available to homeowners, businesses, schools, non-profits and government organizations at a lower cost than they pay for energy generated by burning fossil fuels like coal, oil and natural gas.
Our approach is to install systems to the highest engineering standards while making the switch simple for our customers. We've revolutionized the way energy is delivered by giving customers a cleaner, more affordable alternative to their monthly utility bill.
We call this Better Energy.


Clean energy service on a national scale

SolarCity has assembled one of the most experienced clean energy project design and installation teams in the world. The company serves customers in 15 states with over 45 operations centers.
SolarCity's customers include tens of thousands of homeowners, more than 400 schools including Stanford University, government agencies such as the U.S. Armed Forces and Department of Homeland Security, and well-known corporate clients, including eBay, HP, Intel, Walgreens and Walmart.

We'll see you soon

Founded in 2006, SolarCity has tens of thousands of customers in Arizona, California, Colorado, Connecticut, Delaware, Hawaii, Maryland, Massachusetts, Nevada, New Jersey, New York, Oregon, Pennsylvania, Texas, Washington and Washington D.C. We are transforming the way Americans use energy, and currently provide one out of every four new solar electricity systems nationwide. If our services are not available in your area yet, we hope to see you soon. To keep up to date with our expansion plans, please sign up here.

You thought Arlington was small?

http://youtu.be/naPguX84Amg

Wednesday, January 28, 2015

Video Didn’t Kill the Radio Star

By: Callie Oettinger | Jan 23, 2015 12:30 am

Read in browser »
What would Sir David Lean think of "Downton Abbey?" Image credit: BFI.
In the March 1914 edition of Vanity Fair, James L. Ford discussed movies as a menace to stage.
A hundred years later, in the March 2014 edition of Vanity Fair, James Wolcott called “Everyone Back to the Cineplex” (after two years before writing, in the May 2012 issue of Vanity Fairthat “cinema has lost its sanctuary allure and aesthetic edge over television.”)
In March of this year, Tina Fey and Robert Carlock’s new Netflix series “The Unbreakable Kimmy Schmidt”, will be released, and the conversation that will follow this already-buzzing series promises to be a continuation of the old-as-dirt debate that one format is in decay and another is taking its place.
That argument is rubbish. In the late 70’s, the Buggles sang “Video Killed the Radio Star,” but the reality is that a new medium didn’t kill the radio star or the theatre production or film or books or television shows. Lack of vision killed the second-rate versions of all of these, while the classics survived and the visionaries emerged.
In “Film and Theatre” Susan Sontag asked of theatre, “why should it be rendered obsolete by movies?”
“It’s worth remembering,” she continued, “that predictions of obsolescence amount to declaring that a something has one peculiar task (which another something may do as well or better). Has theatre one peculiar task or aptitude? Those who predict the demise of the theatre, assuming that cinema has engulfed its function, tend to impute a relation between films and theatre reminiscent of what was once said about photography and painting. If the painter’s job had been no more than fabricating likenesses, the invention of the camera might indeed have made painting obsolete. But painting is hardly just “pictures,” any more than cinema is just theatre for the masses, available in portable standard units.”
There’s a real difference. If, one day, theatre does fall under the “abandoned” category (which I hope won’t happen), it won’t be because films killed or replaced theatre. It will be because theatre failed on its own.
During a 2007 panel, titled The Critic as Thinker, critic Stanley Kauffmann said, “Every decade, every year, every month, there’s moaning about the condition of the theatre. And it’s all true. Shaw said once, ‘The theatre is always in a low estate.’ If you look at an anthology of great plays from the Greeks to today, you think, ‘My god, what a panorama of achievement.’ Then you look at the dates and you see that hundreds of years elapsed between one play and the next. Sometimes we have the bad luck to be caught between.”
Again, the problem isn’t always with the format. Often, it’s the lack of talent—or lack of vision.
In his 2013 MacTaggart Lecture, Kevin Spacey introduced many of us to Sir David Lean’s 1990 American Film Institute Lifetime Achievement award acceptance speech,which Spacey said was dedicated “to the idea of promoting and supporting emerging talent. It turns out he was concerned, perhaps frightened by the film industry’s lack of commitment to developing talent and the greater and greater number of films the studios were making that appealed only to the pulse and not to the mind.”
Toward the end his speech, Lean said, “I think the time has come where the money people can afford to lose a little money, taking risks with these new film makers. I think if they give them a break, give them encouragement, we’re going to come up and up and up. If we don’t, we’re going to go down and television’s gonna take over. (laughter from the audience here) Anyhow . . . Wish them luck—I do.”
His speech echoed James L. Ford’s words about the business side taking over the stage, rather than sticking to the box office. The result? Money was spent “on carpets, luxurious cushions, costly chandeliers, decorations, lights—on everything, in fact, that would attract the eye. . . . Everything in the theatre was improved except the acting and the plays.”
The writing, performance and production have to be first. If those lead the way, the formats in which they exist will thrive.
I wonder if Lean would say the same of television now. Would “House of Cards” or “Downton Abbey” be natural crossover’s for him today? Where theatre and film have definitive lines, the lines between film and today’s breakout programming released on television or for streaming via companies such as Netflix, are hard to determine.
Maggie Smith in the “Downton Abbey” series is just as impressive as Maggie Smith in any of her films—and the same holds true for the series production and writing (especially Smith’s zingers). So production and performance and the screenplay don’t define the difference between a TV or streaming series and a film.
Toward the end of “Film and Theatre,” Sontag wrote, “For some time, all useful ideas in art have been extremely sophisticated. Like the idea that everything is what it is, and not another thing. A painting is a painting. Sculpture is sculpture. A poem is a poem, not prose. Etcetera. And the complementary idea: A painting can be “literary” or sculptural, a poem can be prose, theatre can emulate and incorporate cinema, cinema can be theatrical.”
As creativity and risk have faded, and we’ve found ourselves “caught between” a la Kauffmann, it might be best to consider that not everything is what it is. Television can be literary and streaming can be revolutionary and cinema can be low-brow crap (or swing the descriptions around the other way).
The last paragraph of Sontag’s piece:
“We need a new idea. It will probably be a very simple one. Will we be able to recognize it?”
Kevin Spacey and the many others nurturing today’s creative visions seem to have recognized it—that we can bring those very best pieces of theatre and film and audio and painting and photography and writing and sculpture and other art forms together. Instead of working within the constraints of one—or replacing one with another—bring together the best of all (while also ditching old definitions and high-brow/low-brow tags).

Amazonia Core: Yogi Bear

28 January


Warriors, we have been hammering the hips, legs and bum pretty hard. If you did the 5k yesterday and 'Cop a squat' today your thighs are screaming at you, in a great way.

Today, in loo of core we are going to do some beginner yoga, which is basically structured stretching for the hips, thighs and bum.

The following video is pretty good and easy to follow, takes about 10 minutes.

http://youtu.be/63Q-bkjBl_k

Do it right before bed so you can get the max healing effect of sleep. If you are still stiff tomorrow morning do it a second time before work. The stretches she does with a band are great with a partner.

Great job this morning, nothing is better for the bum than squats. Nada.

Tuesday, January 27, 2015

Amazonia: Cop-a-Squat

For: Wednesday, 28th of January 2015

Hyperloop: The future of travel?


Monday, January 26, 2015

Systems Diagrams

Understanding How Factors Affect One Another


© iStockphoto/mevans
System diagrams are powerful tools that help you to understand how complex systems work. Systems analyzed may be anything from businesses, through biological population models, to the impact of social policy, etc.
System diagrams are particularly helpful in showing you how a change in one factor may impact elsewhere. They are excellent tools for flushing out the long term impacts of a change. Importantly, a good system diagram will show how changing a factor may feed back to affect itself!
Drawing a system diagram is a good way of starting to build a computer model. The technique helps you to map out the structure of the system to be modeled. It shows the factors and relationships that are important, and helps you to start quantifying the linkages between factors.

How to Use the Tool

Relationships Between Factors

At the heart of the use of system diagrams is the idea of linking factors to show a relationship between them.
For example a company may link the factors of product quality and customer satisfaction. It believes that as the quality of its goods change, so will customers' happiness with them. We show this as an arrow linking the two factors:
The S shows that the factors move in the Same way – as quality improves, so will the happiness of customers. The arrow shows the direction of the relationship: raising customer happiness does not necessarily raise the quality of the goods!
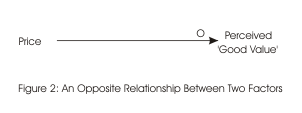
These relationships can also work the other way. The company may link price with the customers' perceptions of the 'good value' of its goods. This is shown below:
The O shows that the relationship works in the opposite way: in this case as you raise price, customers' perceptions of good value reduce.

Feedback Loops

Feedback is an important concept in the use of system diagrams – in very many cases changing one factor will impact on another factor, which will then affect the first.
Feedback will either reduce the impact of the change, or will amplify it.

Balancing Loops

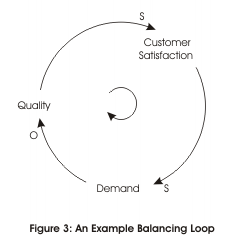
Where feedback reduces the impact of a change, we call this a Balancing Loop. The example below shows an example of a balancing loop, where an under-resourced service company is trying to raise quality:
In this situation, improving the quality of service leads to improved customer satisfaction, which leads to an increase in demand for the company's service. In trying to meet this demand, the company has less time to devote to individual customers, which reduces its ability to improve quality further.
Note the small circular arrow in the middle of the loop. This shows which way round the loop is running. In complex diagrams with many loops, this arrow will be labeled and will identify loops.
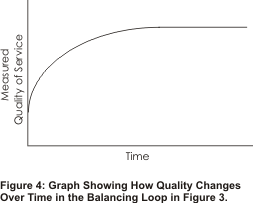
The graph below shows how quality of service might vary with time in the example above:

Reinforcing Loops

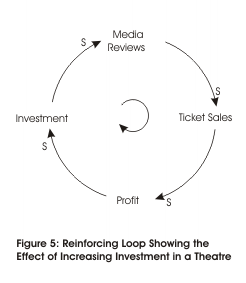
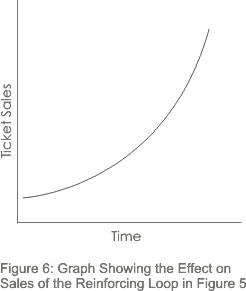
Where feedback increases the impact of a change, we call this a Reinforcing Loop. The example below shows an example of a theatre trying to improve its profitability by investing more in productions.
As more investment is put into a production, the theatre is able to put on more lavish plays with more famous actors. Better plays should bring better reviews, and therefore higher ticket sales. This should lead to higher profitability, and therefore more money available to invest in future productions.
A graph showing how ticket sales might vary against time is shown below:
Note that this assumes that investment is increasing as time goes on. It also ignores some important facts: firstly that there are only a certain number of seats in the theatre, and secondly that external factors such as competition and market saturation will eventually limit growth. On a system diagram showing the way that the theatre operates, these factors would be shown as balancing loops impacting on this reinforcing loop.

External Factors

The system diagrams we have looked at so far completely ignore the impact of these external factors on them.
In our balancing loop example above we assumed that demand was raised only as customers became more satisfied. In reality demand is just as likely to be affected by the state of the economy. This is shown in the modified diagram below:
We show an external factor as a labeled relationship arrow pointing to the appropriate part of the system diagram.

Gaps

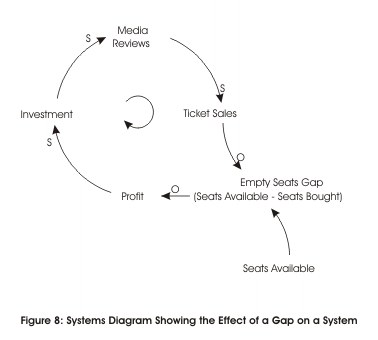
In our reinforcing loop example above we related sales of theatre seats to investment in productions. What we were not able to build into the model was the fact that there is a limited number of seats in the theatre.
Inevitably this will cap the growth of ticket sales as the theatre will seriously upset customers if it sells more tickets than it has seats available!
We build this into our model with the idea of a gap. There is a gap between the number of seats available (an external factor we have not yet built into our model), and the number of seats used (tickets sold).
As the theatre sells more tickets, the size of this gap reduces. At a particular point it cannot sell any more tickets. Increases in investment beyond this point may not yield any more profit.
We show this by modifying our diagram to both show both the external factor of the limit of the number of seats, and to show the gap:
When all seats are sold, i.e. when seats available – seats bought = 0, then profit will not rise any higher unless other factors are brought into the system.
Note that it is very important to get the gap definition correct for your model.

Delay

The impact of delay is the final area we need to consider in our system diagrams.
Ideally when we make a change to a system it should adjust immediately to its new state. In reality there is almost always a delay before other factors adjust. This delay may occur in a mechanical system simply as a result of inertia and friction. In a human system it will occur as people take time to communicate, get used to new ideas, and implement change.
We can show this delay in a simple model using antelopes and cheetahs. As the number of antelopes rises, more food is available for the cheetahs. More cheetahs will therefore survive, and will be able to breed.
One part of the delay within this system is given by the length of time it takes for a cheetah to be born and grow to maturity. The other part occurs as starving cheetahs take time to die.
Feedback occurs as cheetahs kill antelopes. The higher the number of cheetahs, the greater will be their impact on the antelope population.
The system below shows this:
Note the double slash on the line showing the relationship between the antelope and cheetah populations. This shows that some form of delay is slowing the change of the related factor.
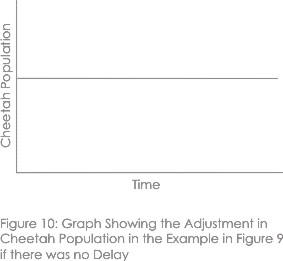
If there was no delay within the system, we might expect to see a graph showing the number of cheetahs over time like the one below:
Here adjustment would be immediate. Any change in the antelope population would be instantly matched by an increase in the cheetah population. These additional cheetahs would eat the additional antelopes, and then die immediately.
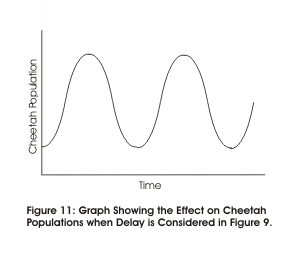
The delay in the system causes it to behave in a different way:
  • Firstly the cheetah population will take time to increase
  • Next, the large population of cheetahs will continue to breed as food starts to become scarce.
  • This number of cheetahs will cause a big reduction in the number of antelopes.
  • This will then lead to a crash in cheetah population as animals starve.
  • The antelope population will then recover as there will be fewer cheetahs to restrict their numbers.
If nothing else has any impact on this system, then cheetah numbers may oscillate as shown below:
This occurs as the cheetah population continually over-adjusts, first in growth, and then in decline. In this system, the longer it takes for a cheetah to breed and starve – i.e. the greater the delay – the greater will be the variations in cheetah populations.

Improving the Systems Model

The models we have looked at so far have been simple – they have ignored many possible impacts on each system. For example, in our model of antelopes and cheetahs, we have ignored the impact of disease, drought, human activity, etc.
We improve the model by building in as many of these external factors as we can think of. We can then simplify it by eliminating those factors that have a negligible impact.
External factors might be:
  • Natural – weather, natural resources, disease, environmental change, etc.
  • Technological – new technologies, changes in technology, etc.
  • Human – psychological, emotional, ambitions, expectations, etc.
  • Political – ideology, corruption, effectiveness, interest, etc.
  • Social – values, social inertia, traditions, philosophies, etc.
  • Financial – state of the economy, capital available, etc.
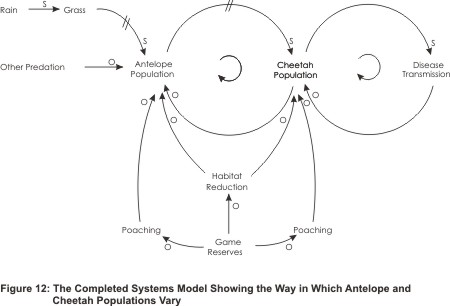
Ultimately you may end up with a model made up of a number of reinforcing loops, balancing loops and external factors. The example below shows a more sophisticated diagram of the antelopes and cheetahs system:
Systems Model Example
Note: This diagram is an example only and does not necessarily reflect how antelope and cheetah populations operate in real life.

Systems Diagrams as the Basis of Computer Models

Once you have established the relationships between factors on your diagram, you can look to see if you can put numbers to the relationships. In the example above you may find that if drought halves the amount of grass available to antelopes, that the antelope population reduces by one third.
You can build this relationship into a computer model. A useful way of starting this with simple and moderately complex models is to build the model on a spreadsheet.
You can use this model to make predictions by changing factors within it. This would allow you to assess the likely impact on your system of external changes, and investigate the effect of changes you might make within the system.

Key Points

Systems diagrams allow you to model the way in which complex systems work. They help you to think through the way in which the factors within a system interact and feed back upon themselves.
You should now be able to analyze:
  • How factors are related, and how one factor will change when another changes.
  • How factors may feed back in either balancing loops or reinforcing loops.
  • How external factors impact on the system.
  • How gaps operate.
  • How delay affects the system.
  • All the complexities of a system.

Sunday, January 25, 2015

Amazonia: Sister Act


All exercises  are partnered.

All sets are 21 reps per partner.

1. 1/4 mile sprint

2. Partner sit and pass

3. Medicine ball situps

4. 1 mile bike

5. Military press

6. Partner hand push  (See 1st Video)

7. Leg throws  (See 1st Video)

8. 1/4 mile max incline elliptical

9. Partner Russian twist and pass (See 1st Video)

10. Partner squat and row (See 1st Video)

Closeout:
1600 meter team row. (200 Meters per)

Rock it, Whoopie is watching.